Digital 3D modeling as it is used in the design and construction industry (and similar industries) has obvious and great value. However, decades of evidence show that its value is commonly overstated, and that the farther one travels down the path established so far for BIM (or for “digital twins”), the farther one gets from utility, and the closer one is drawn into a never-ending slough through the muck, the purpose of which seems to be only some kind of competition to see who is more macho.
I’ll show what I mean in a few graphs. Before the graphs, just one statement that’s very typical of BIM industry rhetoric. This one appears in an interview by Randall Newton in his article, What does blockchain really mean for construction?:
“BIM is very data-centric, and the best way to establish trust is to trust the data itself. …(the) goal is to make the model the unique source of truth. “Today BIM data is not contractual; there are many sources of truth: BIM, PDM, DWG, paper,” says Gueguen. “We believe using Revit as the single source of truth will make the model far better.
Bimchain’s first step is a Proof of Contribution module, where contributions, agreements, and validations are certified on the blockchain and made part of the Revit BIM model. “It is a ‘proof of handshake’ to prove the BIM Manager, the architect, [and others] agreed on the model,” says Gueguen. “We believe this will be able to replace the scattered papers-and-signatures process with an indisputable system.”
Blockchain will make its impact on the AEC industry, no doubt, and Randall’s article explains why. But its impact will be greater, and sooner, the sooner this idea of models replacing drawings is jettisoned.
This comes to the point I want to develop. Industry experience reveals very obvious inadequacies of the medium of digital modeling itself, and yet the response always is to ignore the inadequacies, fail to address them appropriately, blame someone/thing else, double down on bullheadedness, and latch on to the next shiny object that this time is going to justify and validate the inadequate.
Very macho indeed.
All things in this world have both scope and limits. Digital modeling is no exception. It’s scope (the extent of what it is and can be) is vast and highly valuable. But it has also, like all things, limits. The limits of modeling are both real, and very substantial. They need to be addressed, unless an endless crawl through the mud is the desired goal and reward.
I discuss in detail both the scope, and the limits, of both the medium of drawing and the medium of modeling in Chapter 2 of Tangerine Media Innovation Spec 2018. The book is free — read it here on Apple Books or here as PDF. (See updated 2021 version download links below). May I humbly suggest that the book is worthwhile reading? It should be of interest to practitioners and software developers alike. Likewise for Chapter 3, which is a specification for software developers. It specifies (I will be proven right on this eventually) the future of digital media. Any software company interested can read this and pioneer the future of media itself starting from the ideas and instructions I develop in the book.
edited: an enhanced, extended, updated version of this spec was completed in 2021. Download links for the newer version are here: https://tangerinefocus.com/
The limits of digital (or physical or mental) modeling are two:
- as models are wide and expansive whole things, they surpass our human ability to wrap our minds around them. To the extent that we require to understand models more than just superficially, models overload our ability to grasp them. We require certain devices (other media) to assist us in understanding them.
- models, by themselves, provide no means with which we can assert and affirm that, at any particular location within them, that what should be shown there is shown there and that nothing that matters there is missing.
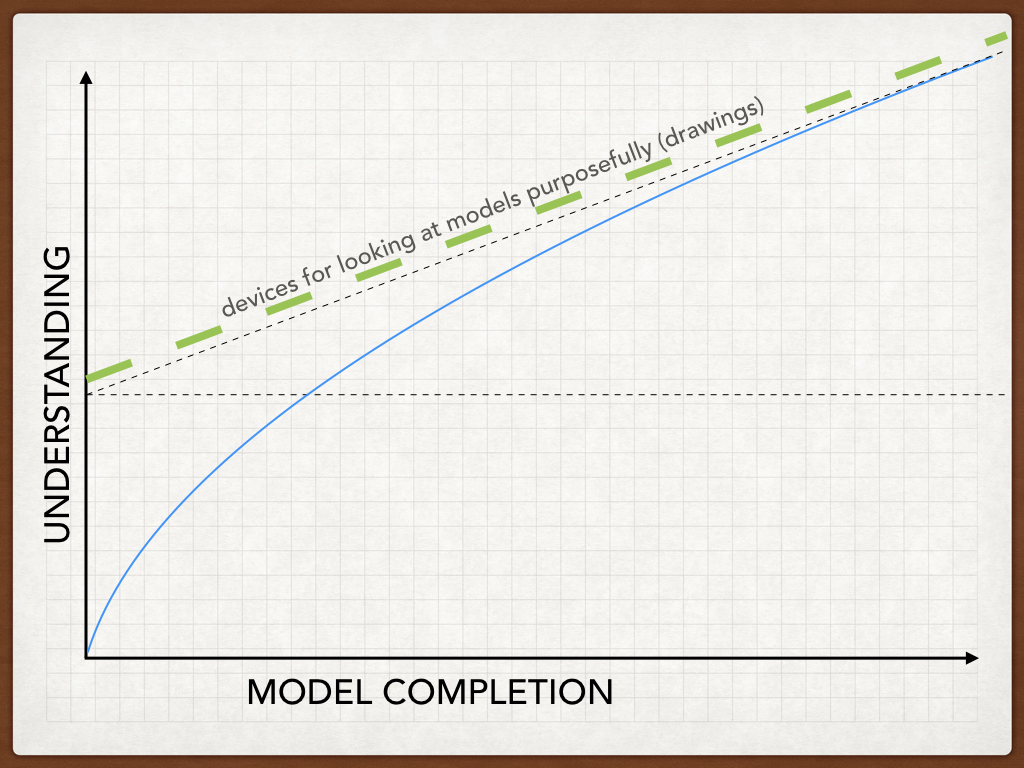
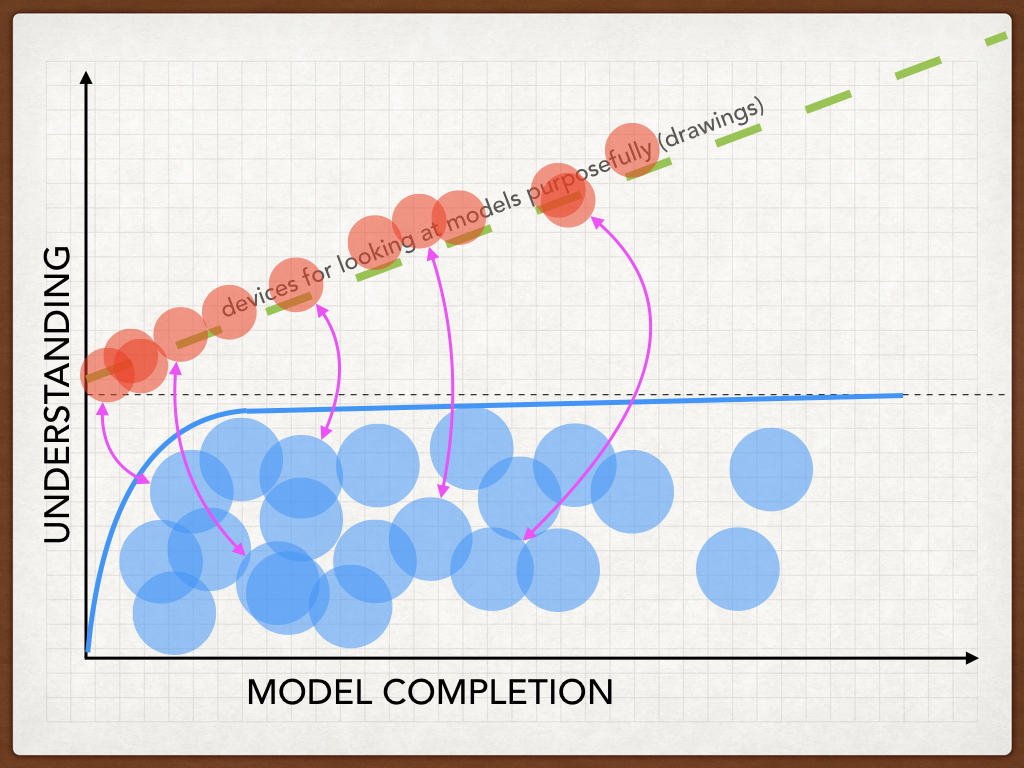
Moving on to the graphs now that show where “BIM” becomes intellectual machismo. Let’s draw a curve plotting extent of project understanding on the Y axis against extent of model completion on the X:
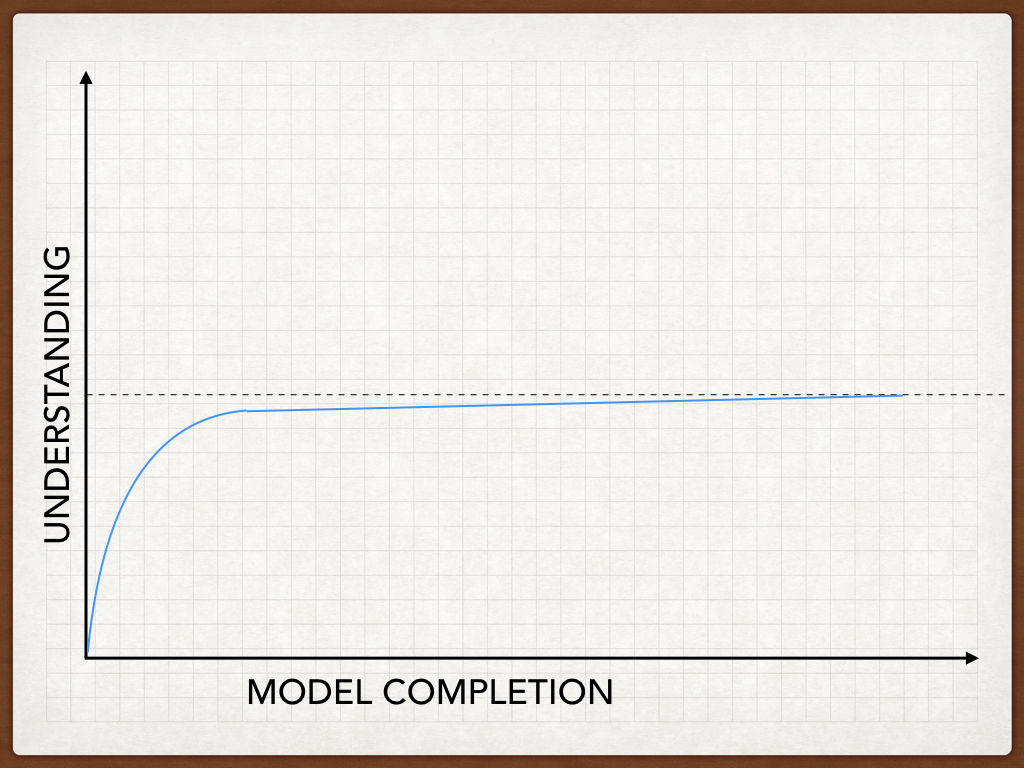
As modeling begins, understanding rises rapidly. As model completion increases toward the right, gains in understanding slow and then approach an asymptote. Greater and greater effort put into more and more modeling delivers diminishing return in terms of increased understanding the project. The diminishing return, and finally no return, is a function of confrontation with the fundamental limitations of the medium of modeling itself (1 and 2 above).
BIM industry machismo can be observed in the determination to continue modeling with negligible gain in understanding. I should emphasize here the extent of this kind of macho determination that’s now typical. Though anyone who’s been in this business doing this themselves, well and truly knows this already. What remains, only, is the extent to which they’re ready to admit it.
Let’s add the medium of drawing into the graph. Let’s call drawings “devices for looking at models purposefully“:
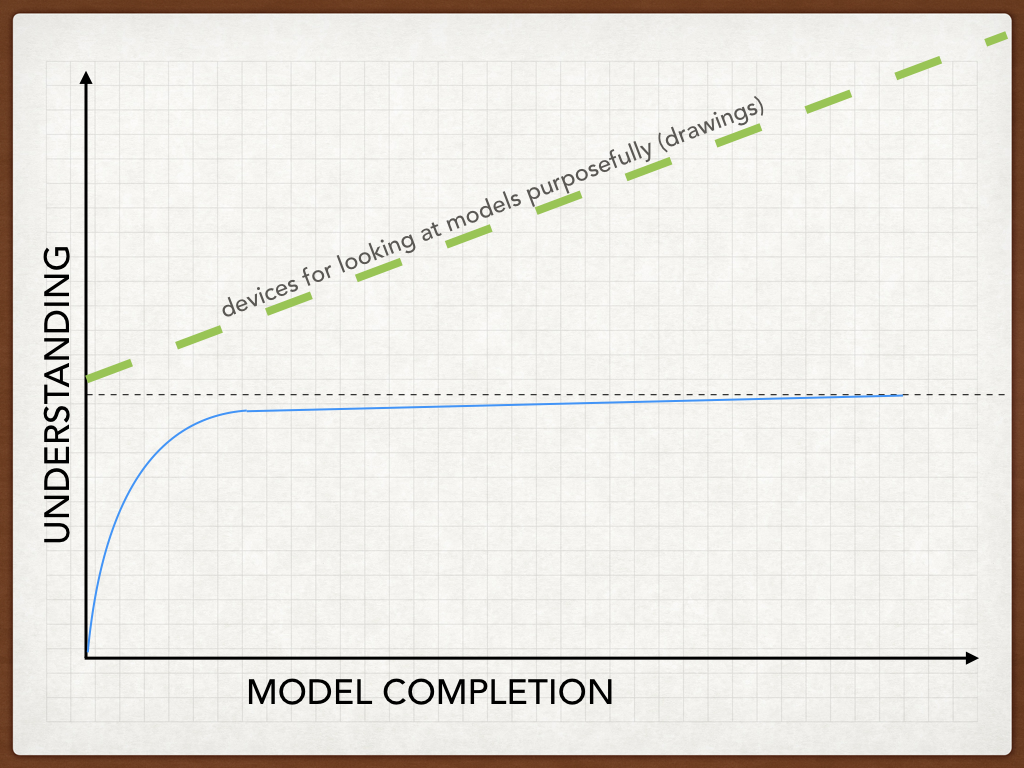
Drawing acts in a very energetic way to pull the understanding curve in the positive Y direction toward greater understanding.
We’re gaining two strong positives. Increased understanding (which is kind of the point). And increased value derived from our modeling efforts:
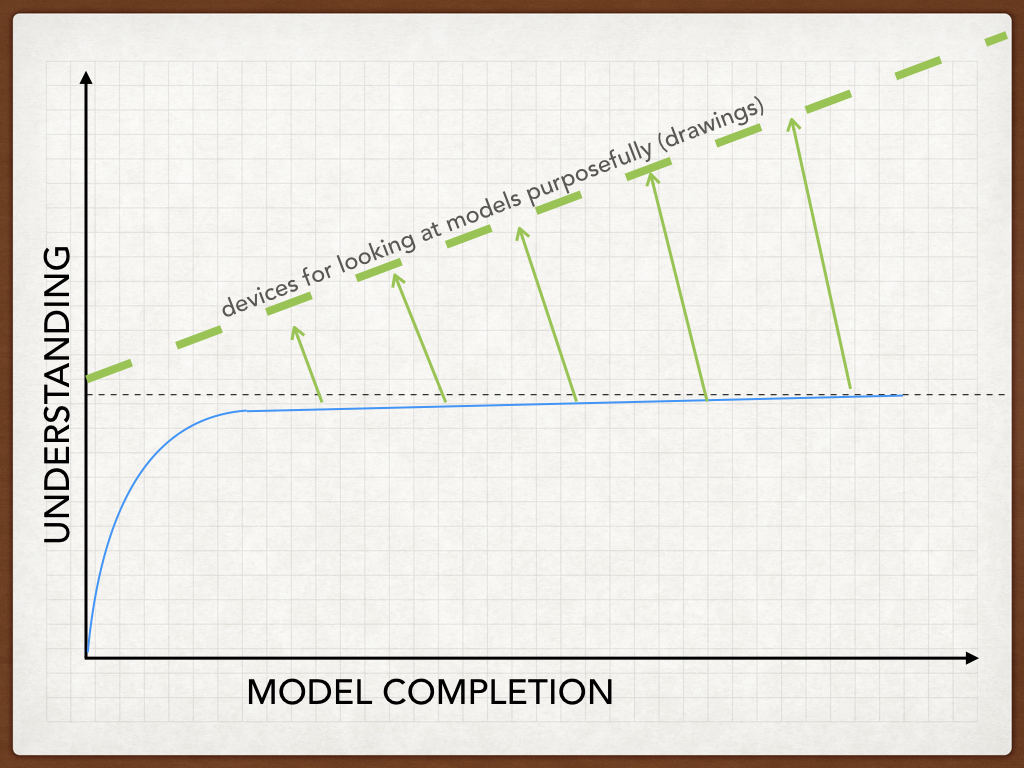
We can adjust the slope of the new asymptote line. The angle of course will vary depending on many factors. However, it’s the general effect that’s of interest, as well as the mechanism for it. I’ll describe the mechanism of the uplift in understanding.
But first, note that the more we model and draw, the more we understand! There’s a win-win situation. Our understanding still has a limit, but, the more effort we put into study through drawing and modeling, the more our understanding grows. That’s the kind of curve we need, as opposed to the earlier curve where after a certain point quite early, our efforts fail to return gains in understanding.
I add another dashed line, a horizontal dash in red:
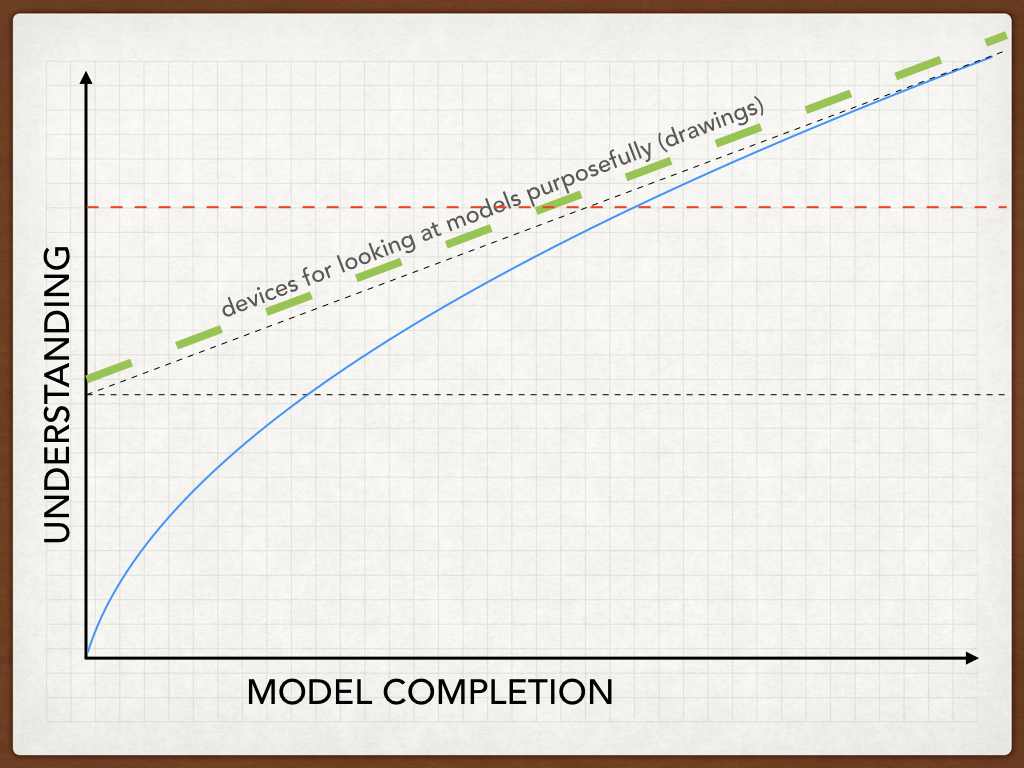
This line is important as it indicates, for a phase of a project — design, construction, or a blend of concurrent design and construction as is the case sometimes — it indicates where the level of project understanding is sufficient, beyond which further understanding is unnecessary. If anyone hyperventilates at such an idea, suffice it to say that, for example, when construction is completed and handed over to an owner, the construction team reaches a practical limit at which it will no longer continue to invest in further understanding of the project, other than for ancillary purposes. Naturally, the owner will take over investment in understanding the built asset, but this would be represented by a new graph, with, as for the design and construction team, understanding rising through study of models and drawings in tandem, together with direct experience with the real facility.
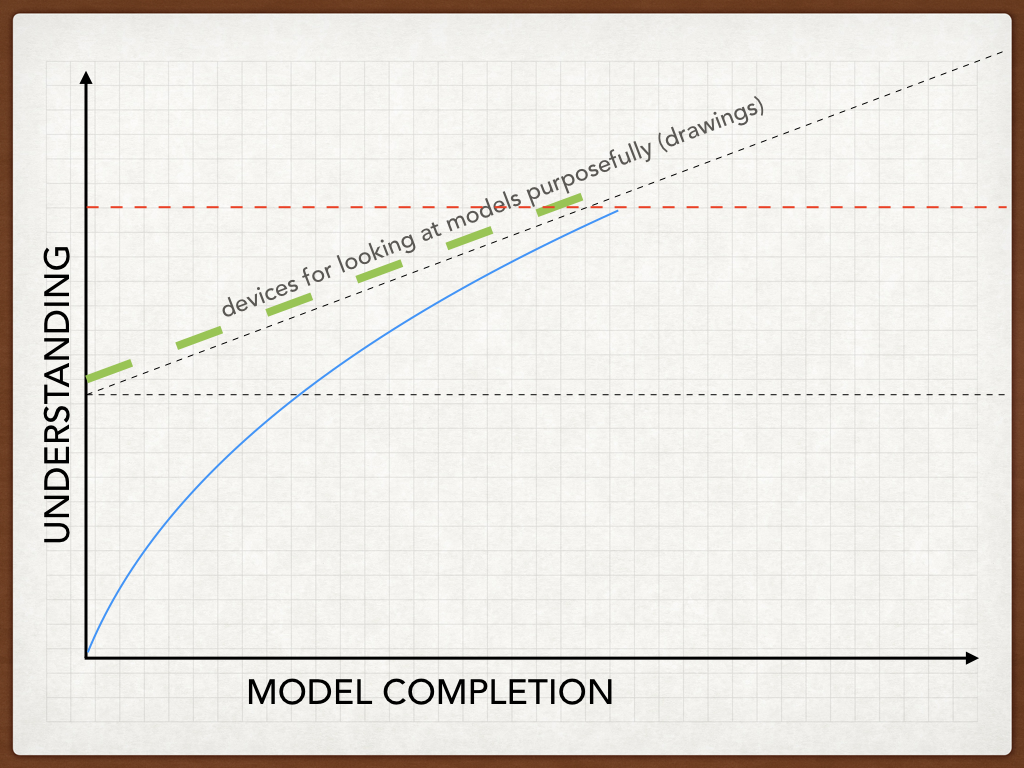
In any case, in such a scenario, the construction team may (will) cease its knowledge investment at the red line, so modeling and drawing would cease there:
Such is the basic nature of the design, construct, operate lifecycle. And for that matter, here’s another very simple graph. It shows the relationship between actual reality (things as they are) and proposed reality (things as they are designed):

Things as they are, at the start of a project lifecycle, are different than things as they come to be proposed. There is a wide gap between what is, and what’s designed. Hence the blue and red curves are far apart during design. The purpose of construction is to move the red curve (things as they are) toward the blue curve (things as they’re designed):
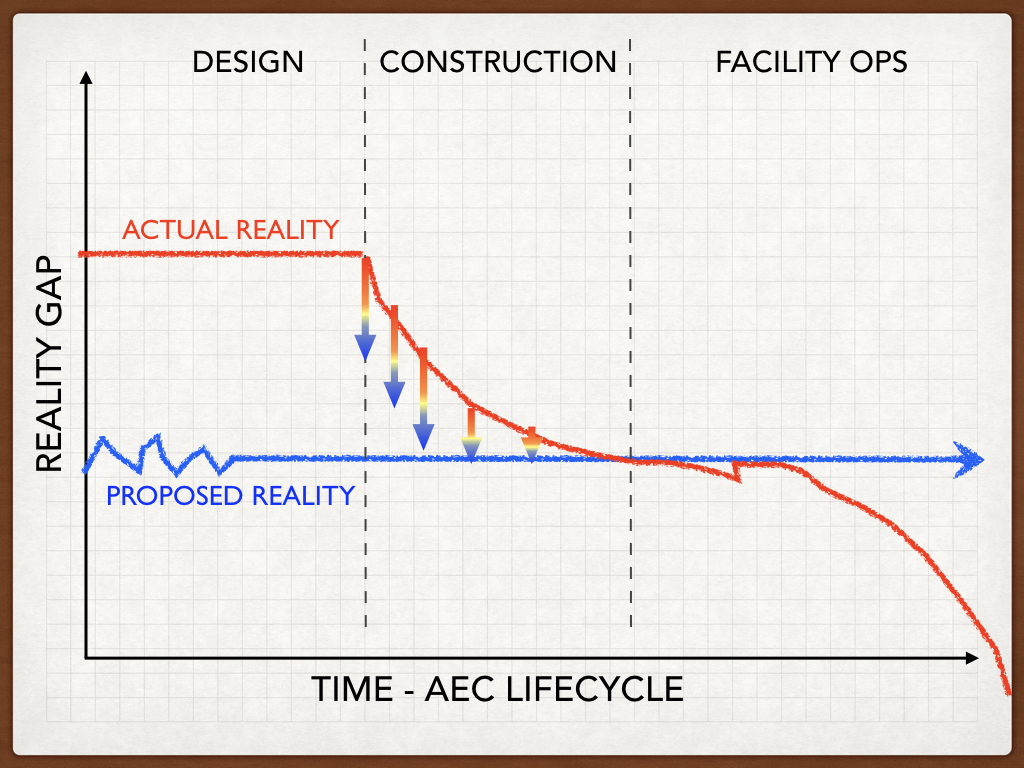
At the completion of construction, things as they are, actual reality, becomes things as they’re built, “as-built”. So at the end of construction, the as-built reality, red curve, comes as close as it will come to what was designed (the blue curve).
Thereafter, during facility operations, actual reality moves away again from proposed reality as entropy takes over. Nature has its say and nature says its going to degrade your facility and thus maintenance is required to push back against decay and keep systems in optimal condition in conformance with designed reality. Naturally, if maintenance is not performed, over time the facility will degrade to ruin, which again creates maximum distance between actual and proposed reality:

This segues back then to the model completion / understanding curve. During each of the major lifecycle phases in AEC, there is an appropriate cutoff line after which further investment in understanding is no longer made. Though handoff is made to the next phase, at least part of the team that made its investment in understanding can appropriately retire its efforts, as again shown here, with efforts cut at the red dash:
The simple point being that these two sets of graphs are related in the following way. The purpose of drawing and modeling is to gain understanding. And the purpose of understanding is to contribute effectively in the AEC lifecycle — during design to make an appropriate and effective design, during construction to move actual reality toward proposed reality, and during facility operations to keep the facility in optimal working order. It is toward these aims that understanding is directed, and beyond these aims, investment in understanding is ordinarily not funded.
The Mechanism of Understanding
So what is the mechanism of understanding? By what means does drawing pull the modeling/understanding curve toward increased understanding? How does it do this?
The answer goes to absolute fundamentals. The activity of thinking is represented by the pink arrows (next image, below). Thought, of course, produces understanding, and thought, it seems, functions through some kind of back and forth ping-ponging between the wider perceptible environment (like a model) and articulating acts of narrowing focus (like drawings). So in the graph below, drawings are developed over time (the green dash, now supplemented for emphasis by the red circles), while models are developed below the blue curve. The mind at work (the pink arrows) bounces back and forth between these and from this action, evidently, thinking happens, and understanding grows. Certainly I am no neuroscientist, and nor would anyone in the science of the study of mind presume to even begin to say how cognition works (it remains an almost total mystery). However, we can observe some of the most basic dynamics of its function: there is wide (environment), and there is narrow (focus, taking a purposeful and closer look). And these are in interplay.
In this interplay, some kind of energy is generated that results in the inexorable growth of understanding, and so the blue curve is moved in the positive Y direction, toward greater understanding:

So now in the field of AEC, or the field of software for architecture, engineering, and construction, when one talks of jettisoning the medium of drawing in favor of the medium of modeling, then one is denying the basic observable dynamic of the growth of understanding, and hacking at the root of cognition itself. No small error indeed.
Let me give an example, a very nice one in this 35 second film clip recently posted on Linkedin by the film maker Jim Cummings. Here’s the video link.
Take a cue from this, the essence of narrowing focus and taking a closer look:

I mean, we all relate to that viscerally. It goes right to the core of what we do when we understand anything anywhere. We’re ping-ponging our perceptions between the wider expanse of the environmental whole of a place, and the various articulating acts that we undertake of narrowing focus and taking a closer look at something that matters. In this back and forth, meaning is formed, understanding grows. We come to know a thing, and a place.
This of course relates directly to AEC media in the sense that the wider environmental whole of a place is the model, while the articulating act of narrowing focus, to take a closer look at something that matters, is an act well and truly embodied in the medium known as “drawing”.
Note that we don’t understand one without the other. We don’t understand the closer look at the woman giving directions in the cab, without the wider environment of the city within which this narrowed focus finds its subject. And the reverse is true too; we fail to grasp and make sense of the wider environment (of the city in this case) without a continuous series of closer look events that we engage ourselves in. Our minds are drawn to clarifying moments, and orienting views high and low, large and small. The sum of these, within the context of the dynamic interplay between environment and focus – well, that seems to describe, hopefully to some useful extent, the engine of cognition.
So what then?
None of this matters to those committed to a continuous contest of ¿Quién es más macho?
But for anyone who wants better media that’s better fuel for cognition, new innovations in media that will define the future of media itself, and for any software companies that want to pioneer that and bring it into existence, well I can only say, the future is there, waiting for you to define it.
The ideas in the Tangerine Media Innovation Spec 2018 (free on Apple Books, and in PDF for download) will evolve the nature of “drawing”, the nature of its expression, amplifying the way that we “draw attention to”, “take a closer look”, within modeled environments, moving beyond the first generation drawing-model fusions first made available in commercial software in 2012. The new evolution of fusion described in the Tangerine Spec, now, will bring new and effective, compelling and engaging means for interaction with modeled environments, extending the centuries long legacy of drawing in new ways.
These innovations will have a secondary effect on the field of cognitive computing. This slide deck (5 slides) gives a short intro.
So is it a machismo contest? Or do we move forward in ways that matter?